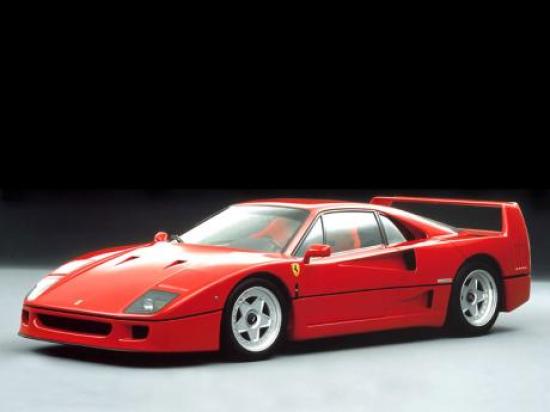
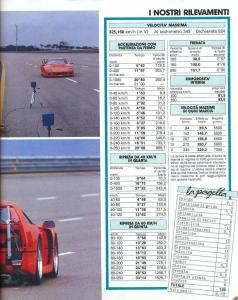
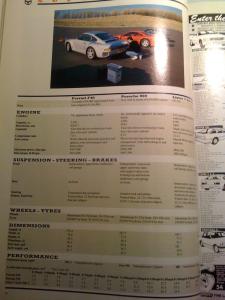
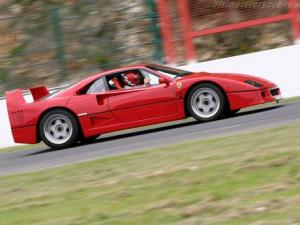
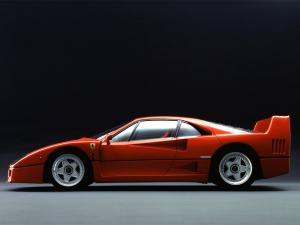
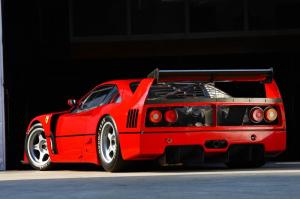
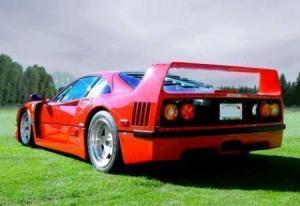
Image of Ferrari F40

Ferrari F40 specs

Price in US $471,375
Car type Coupe
Curb weight 1099-1369 kg (2423-3018 lbs)
Dimensions 4.43 m (174 in) long, 1.99 m (78 in) wide, 1.13 m (44 in) high
Wheelbase 2.45 m (96 in)
Introduced 1987
Origin country Italy
Gas mileage 32.0-8.6 l/100 km (7-27 mpg US / 9-33 mpg UK)
CO2 emissions 250 g/km
Views 135.7k

Performance

0 - 40 kph1.5 s
0 - 50 kph2.0 s
0 - 60 kph2.2 s
0 - 70 kph3.0 s
0 - 80 kph2.9 s
0 - 100 kph4.0 s
0 - 120 kph5.5 s
0 - 140 kph6.5 s
0 - 150 kph7.2 s
0 - 160 kph8.0 s
0 - 180 kph9.3 s
0 - 200 kph10.4 s
0 - 220 kph13.8 s
0 - 240 kph16.4 s
0 - 250 kph17.8 s
0 - 260 kph20.1 s
0 - 300 kph31.0 s
100 m5.4 s @ 119.2 kph
1000 m20.2 s @ 265.0 kph
0 - 30 mph1.6 s
0 - 40 mph2.2 s
0 - 50 mph2.8 s
0 - 60 mph3.8 s
0 - 70 mph4.6 s
0 - 80 mph5.4 s
0 - 90 mph6.7 s
0 - 100 mph7.7 s
0 - 110 mph9.5 s
0 - 120 mph11.0 s
0 - 130 mph13.5 s
0 - 140 mph15.6 s
0 - 150 mph16.2 s
0 - 160 mph21.3 s
0 - 170 mph26.3 s
Est. 1/8 mile8.4 s @ 102.5 mph
1/4 mile11.7 s @ 126.5 mph
Est. 1/2 mile19.0 s @ 159.7 mph
Est. 1 mile29.7 s @ 184.5 mph
Top speed327 kph (203 mph)
0 - 100 mph - 013.8 s
Est. max acceleration0.68 g (7 m/s²)
Lateral acceleration1.01 g (10 m/s²)
Ferrari F40 acceleration graph

Powertrain specs

Engine type twin turbo V8, 32 valves
Displacement 2.9 l (179 ci / 2936 cc)
Power 478 ps (471 bhp / 352 kw) @ 7000 rpm
Torque 575 Nm (424 lb-ft) @ 4000 rpm
Power / liter 163 ps (161 hp)
Power / weight 374 ps (369 bhp) / t
Torque / weight 450 Nm (332 lb-ft) / t
Efficiency 27 PS per l/100 km
Transmission 5 speed manual
Layout middle engine, rear wheel drive

More 0-60 and 1/4 mile times

Braking distance

60 kph - 013 m (44 ft)
100 kph - 037 m (122 ft)
120 kph - 054 m (176 ft)
140 kph - 073 m (240 ft)
160 kph - 096 m (313 ft)
180 kph - 0120 m (394 ft)
200 kph - 0149 m (490 ft)
60 mph - 036 m (119 ft)
70 mph - 066 m (218 ft)

Rolling acceleration

60 - 100 kph (4)6.3 s
80 - 120 kph (5)8.5 s
80 - 160 kph (5)16.1 s
70 - 100 kph8.2 s
70 - 120 kph12.6 s
70 - 140 kph16.1 s
Est. 100 - 140 kph2.2 s
Est. 100 - 200 kph7.0 s
Est. 200 - 300 kph19.6 s

Interior noise

Noise @ idle65 dB
Noise @ 100 kph81 dB
Noise @ 130 kph84 dB
Noise @ 160 kph90 dB
Noise @ 180 kph92 dB
Noise @ 50 mph82 dB
Noise @ 70 mph84 dB
User avatar
User avatar

FastestLaps  3w ago

Fair to say it's pretty dramatic driving experience


User avatar

Crispi74  1m ago

Anyway it was said that Tipo USA F40 was rated to be around 515 hp. It seems that during the process to refine gasses engineers found some extra power. In my idea that was just partially true, because lots of EU F40s were enough powerful to be faster than US cars. I always tought that that happens because of the same process of engine production more than other choice and no matter the figure Ferrari power claimed.


User avatar

cosimo  1m ago


User avatar

cosimo  1m ago


User avatar

wallenieswiftie  2m ago

The Robocop of cars.

84918115dc10.png?550x800m


User avatar

TypeF171  3m ago


Ferrari F40.


User avatar

jeremyclarkson1  3m ago

https://en.wikipedia.org/wiki/List_of_Top_Gear_test_track_Power_Lap_times

So the Top Gear lap was a "Did Not Start".
@FastestLaps can I add this time?


User avatar

GriN  4m ago

d63816555cbb.jpg?550x800m


User avatar

GriN  4m ago

b81b4e5570.jpg


User avatar

cosimo  5m ago


User avatar

cosimo  5m ago

fake f40


User avatar

Thiago_Lins  6m ago

Are there top speed figures achieved by the Ferrari F40 GTE in the BRP Global GT Series in 1995/1996?


User avatar

GriN  6m ago

21779566528-0480597410-k.jpg
21779331850-22a2be1644-k.jpg
21344693844-ca26daf56c-k.jpg


User avatar

cosimo  6m ago


User avatar

GriN  6m ago

7005692944-161ec5a22b-o.jpg
с


User avatar

GriN  6m ago

ferrari-f40-archived-test-review-car-and


User avatar

Crispi74  10m ago

Auto Pur 1/94
Ferrari F40 road test
0-100 kph 4.0s
0-200 kph 11.0s
Dyno test: 504 PS @ 7000 rpm


User avatar

FastestLaps  10m ago

Added!

504 PS in 1987.... And that's from a restricted capacity engine and tuned for road use (semi-reasonable emissions, consumption, noise, idle speed etc).


User avatar

Crispi74  10m ago @FastestLaps

504 PS from a car that ran a 100-200 kph in an improvable 7 seconds.


User avatar

Metatron  10m ago @Crispi74

The ONLY non account even worth bothering or interacting with and learning from, in the years I've been here, bravo long may it continue.

This Ferrari F40 thread will be like the last. Legendary!


User avatar

Crispi74  10m ago @Metatron

Thank you very much!


User avatar

Crispi74  10m ago @Metatron

An interesting aspect of the F40 was the cooling of the turbocharged system.
Air temperature is one of the main points of the combustion so air boosted into engine need to the well cooled before to be breate. The revolutionary aspect which it was not fixed in the 288 GTO was that.
Infact during road test 288 GTO lost power when the car was launched during hot days. It wan't like that with the F40. Quattroruote Italian magazine tested a powerful F40 on a hot day in summer that doesnt lose power in comparison to F40s tested in way better conditions as the Cargraphic magazine did. If the cooling system hadn't work as it should we would have seen a drop in acceleration for overheating of the turbocharged system.
On the other side, I still have to understand on the right way if this brings a power improvement with speed crescendo, once in cool conditions. Some cooler condition tests made give the assumptions.


User avatar

Metatron  10m ago @Crispi74

The 288 GTO lost power, on hot days? Well as you said this in part explains why the F40 was so quick and fast! Interesting as your maximising what's already available!


User avatar

Crispi74  10m ago @Metatron

It's evident that during 288 GTO and Evoluzione development the aspect of the surface of radiant mass or fluid dynamic to the intercoolers was not treated at best. Having a system that keeps the inlet air temperature as low as possible on different ambient temperatures means engine power reserve.


User avatar

Crispi74  10m ago @Crispi74

Because it is normal to say that an intercooler works better at speed, on that case need to take attention on cold air throught faster on the intercoolers means even more power. That's my question.


User avatar

Lambolover  10m ago @Crispi74

"It wasn't like that with the F40."
Edmond Mondi disagrees


User avatar

Crispi74  10m ago @Lambolover

That car doesn't run as fast as correctly. Mainly it run underboosted at 12 psi on full throttle runs and the boost needle of the gaude is tired to rise high. we can see on the video. at around min 13:00.


User avatar

Crispi74  10m ago @Lambolover

https://ibb.co/y5w4nNg
Screenshot of the boost gauge running at 6000 rpm of the purple car.

https://ibb.co/JRjS2n4
Correct overboost running at 6000 rpm.


User avatar

Lambolover  10m ago @Crispi74

Doesn't that mean it makes less power and therefore the same thing that happened to 288 GTO has also happened to it?


User avatar

Crispi74  10m ago @Lambolover

Ah get it what you are meaning! NO these are two different things, the GTO I mean it make less power because the cooling of the turbocharged air was evidently undersized. But no other issue.
The problem that affect the F40 owned by this guy is an issues of engine cooling, that evidently it desn't able to can't make the fans work enough or meantime. Gauge wather temperature seems to high so it seems that something in the engine cooling system is struggling. That car was a Tipo USA specs made with catalyst system adjusted for those countries so compensating for temperatures can be an adventure for the cooling system explecially if It seems that something is not running correctly or in order. I often see underboosted Tipo USA F40s, I don't understand if it was a choice of the dealer assistant technicians or something. At fact that car was under powered and overheated on that circumstance.


User avatar

Crispi74  10m ago @Crispi74

I add, if that guy was not enought qualified to get that a 80's car made for racing used asbestos-free brake pads and that noise comes from there, or unqualified to get that something was not right on cooling electrosystem of his car I think the car is not in the right hands!


User avatar

Crispi74  10m ago @Crispi74

"I often see underboosted Tipo USA F40s, I don't understand if it was a choice of the dealer assistant technicians or something. "

As for example, the Tipo USA F40 tested in CARWOW video versus the Bugatti EB110 GT was also underboosted looking at the boost gauge.

I think that videos running underboosted turbocars make no sense expecially if driven by hamburger eaters that doesn't even know how launch and how gaershift a car.
Looking at the revs counter and the noise of the engine it's easy to get as under revs those gearshifts.

I'm the first to respect a 3M$ car, but please youtuber make videos how they need to been made, othervise is just misleading info or untrue.


User avatar

Beaumont Coolidge  10m ago @Crispi74

Americans are too fat and turbo cars with high boost pressure is known to affect their IQ level, so the EPA decided to lower the boost pressure, in order to have a healthier life and not suffer a sudden heart attack.

In other words, their cars are slower and heavier + pig sized driver adds another big fat penalty and turns the whole formulae into a junk food cabin with cup holder and a tray with speakers and subwoofer.

Life in America is all about straight line acceleration, 0 to 60 and 1/4 mile run.


User avatar

FastestLaps  10m ago @Beaumont Coolidge

Oh dear... cosimo vibes


User avatar

RickyAstle98  10m ago @Beaumont Coolidge

Youre too fat for this site, zero braincells, your life is all about skunking anything?


User avatar

196ss  10m ago @Crispi74

Greetings, dear friend!
Nice to see you here again, glad you are continuing your research.

On the other side, I still have to understand on the right way if this brings a power improvement with speed crescendo, once in cool conditions. Some cooler condition tests made give the assumptions.

I think if you had the time and opportunity, you could pick, say, a dry hot day and a dry cold day, and take several consecutive acceleration measurements in 2nd and 3rd gear starting at low rpm. While fixing the cooling system temp before and after each run.
I think that would provide a ton of information to analyze. Still, there's no better way to confirm a theory than experiment)


User avatar

196ss  10m ago @Crispi74

By the way, I think I'll do a similar thing on my car.
However, I have a turbodiesel and a more modern construction)
But, still interesting for comparison...


User avatar

Crispi74   10m ago @196ss

Hello 196ss,
that kind of experiments should been interesting to do. Firstly, I will try to find examples around the web. Anyway yes every different turbo car could be affected by these kind of temperature of cooling variable depend of their size of the system or how is efficent.


User avatar

Metatron  10m ago @Crispi74

Yes I completely forgot about the Ferrari 288GTO Evo. I'll have to read up on it!


User avatar

Metatron  10m ago @RickyAstle98

Mimicry too. Smh.


User avatar

Metatron  10m ago @Beaumont Coolidge

"Life in America?". You've never been LMFAO.


User avatar

Crispi74  10m ago @196ss

I think if you had the time and opportunity, you could pick, say, a dry hot day and a dry cold day, and take several consecutive acceleration measurements in 2nd and 3rd gear starting at low rpm. While fixing the cooling system temp before and after each run.
I think that would provide a ton of information to analyze. Still, there's no better way to confirm a theory than experiment)<<

Mainly we can say that the difference between air/air and air/water intercoolers is precisely in the fact that the latter has the best heat exchange at low speeds to remain constant at higher speeds. The former, on the contrary, is not efficient at low speeds but it works at speed. So here, as the more air flow is, as the better heat exchange is.


User avatar

Crispi74  10m ago @Crispi74

What I was saying is that till we are running on hot conditions it works limiting heat exchange damages, but at contrary, running on cold we can have heat exchange advantages.


User avatar

Crispi74  10m ago

https://ibb.co/PWwNqJv
https://ibb.co/bRgppHN
https://ibb.co/hyZ9rsg
https://ibb.co/X2BsVb2

Here a very interesting article F40 vs Hamann published by Motor 1994


User avatar

Crispi74  10m ago @Crispi74

Concerning Hamann car there are lots of details to treat. First of all is that article claims 1,5 bar of max boost but published pictures of the interior shows a boost gauge positioned close to the gearbox lever that reveal a boost addressed to 1,9 or just below 2 bar. I don't know if there was a peak of overboost or boost was setted only by the double wastagetes.
The magazine Tuning Special Cars from Japan explains that the peak was boosting up to more like 1,8. I wouldn't want that final power would be much grater than 620 PS claimed.

https://ibb.co/pjkn0nQ

Than, with boost setted to 0,9 bar producing about 545 PS the car seems faster but not much faster than the standard catalysed version tested at the side. Sound as interesting detail because that almost justifies that the standard car seems again underestimated


User avatar

wallenieswiftie  10m ago @Beaumont Coolidge

Imagine thinking straight-line performance was EXCLUSIVELY an American priority or vice versa. Are the Lotus Carlton and Mercedes C/E-Class V8 models a joke to you? What about the new Cadillac CT5-V Blackwing which is better on most tracks than the M5 CS, GT63S AMG, and Panamera Turbo S?


User avatar

Crispi74  10m ago @Crispi74

The magazine Tuning Special Cars from Japan explains that the peak was boosting up to more like 1,8. I wouldn't want that final power would be much grater than 620 PS claimed.<<

Indicatively power will jump from 660 to 670 PS looking at that boost level.


User avatar

Crispi74  10m ago @Crispi74

Indicatively power will jump from 660 to 670 PS looking at that boost level.

I'm correcting myself, I'm more inclined to think the car deliver 620 PS but provided of transitory overboost.

https://ibb.co/S08Wcw7

That picture comes from Max Power magazine, the article said the car was tested at 0,9 bar but pictures seems overboosting close to 1,3 on the gauge.


User avatar

Crispi74  10m ago @196ss

It would be interesting to recalculate the performance panel of the Hamann car. Lot of time ago I found a web document that claimed 0-100kph 3.8 and 0-200kph something like 8.2 for the car, weight was 1202 kgs but I'm unable to find it again. Maybe it isn't online anymore. To make the acceleration panel as more accurate as possible it need to know the torque curve that for sure, but looking at how overboost works as high as 1.9 bar, I'm not surprised if torque will jump well over 70 Kgm somewhere from 5000 to 6000 rpm.
A recent article of the car (I'm sure because of exactly the same VIN number) claimed 72 kgm @ 7000 rpm, and 720 PS @ 7500 rpm, but the car was recently completely restored, using obviously a more aggrassive setting of the engine and current parts.


User avatar

196ss  10m ago @Crispi74

That's the same power/torque numbers as quoted for the F40 LM.


User avatar

Crispi74  10m ago @196ss

Yes similar as one of the earlier specs claimed for the F40 LM (later numbers were higher for the LM, up to 800 hp and more). But not so interested in the performace as is today imho, today the car is became like a hybrid Hamann/Michelotto.


User avatar

196ss  10m ago @Crispi74

I'll do a recalculation, but not in the next few days. Not have possibility yet.
If you can provide a power graph it would be very helpful.


User avatar

Crispi74  10m ago @196ss

Unfortunately a Hamann power graph is unavailable to provide, consider that the power could be:

Max power by mags seems to be 622 PS @ 7800 rpm but also 620 PS @ 7100 rpm seems already available.
Torque could be no less than 700 NM somewhere from 5000 to 6000 rpm at least. Maybe 730 Nm at top.

The web article of the restoration claims also power was rated as much as 640 BHP at the racing period.
http://build-threads.com/build-threads/ferrari-f40-lm-restoration/
" ...Unusually this car ran twin KKKs with twin waste gates and produced about 640 BHP..."

Power could be there, maybe engine dynoed 622 PS as new and 640 BHP later as used, I think no more, but engine delivering more torque than the 68 kgm of the 288 GTO Evo.

Here the graph of the 663 PS Sportec F40 running 2 bar of boost. Also 789 Nm on top. The Hamann engine I think was a bit lower than that. As I provided period pictures of the boost gauge it was indicated peaking less than 2 bar. Ok are two different tuners, two different periods, but I think correlated results.
https://ibb.co/8rZVPR2

So, I'll leave your interpretation of curve. Do your best. We have a suspected 0-100 kph 3.8s and 0-200 kph 8.2s to confirm as is possible.


User avatar

196ss  10m ago @Crispi74

Thank you for the link about the F40 LM restoration!
It's a great read. My family lost me for the entire evening.


User avatar

FastestLaps  10m ago @196ss

One can cry about how expensive classic cars have become, but obvious benefit of this price appreciation is that no expense is spared and even most abused and bruised examples of cars like F40 are fully revived and remanufactured down to every nut and bolt.

But who will revive today's cool cars that have so many proprietary electronics and software in them?


User avatar

ih8Tesla  10m ago @FastestLaps

Wait till the EV fanboys takeover the streets and see them brag about their 1000 PS cars and how smooth and fast they can outrun anything ICE and shoots up smoke and flames.


User avatar

koenigseggjesko  10m ago @FastestLaps

But you know what cars can't become expensive

https://images.app.goo.gl/LxwWKidxLRfVUT2J9


User avatar

FastestLaps  10m ago @ih8Tesla

Yet we still have booming mechanical watch industry....

And race horses.


User avatar

koenigseggjesko  10m ago @FastestLaps

I have a new post coming up. here is some info about it on Youtube https://youtu.be/mkxer6pxQ6I?si=SBlZ9zzgQyMJl8tt.It will come in about 25minutes just reading through


User avatar

koenigseggjesko  10m ago @FastestLaps

I have a question: how do you add different images in one post?


User avatar

...  10m ago @koenigseggjesko

WTF is that trash boy?


User avatar

VenomF12  10m ago @...

your bugatti kid right?


User avatar

Crispi74  10m ago @196ss

I'll do a recalculation, but not in the next few days.

https://ibb.co/8rZVPR2
If you are intersted linked there is also the diagram of the stock F40 before to be tuned, result 506 PS and 646 NM. Similar figure to 504 PS of the car published in Auto Pur magazine.

Whe you did calculations your figures referred were:

One of the sources said 520 hp and 615 Nm..


User avatar

196ss  9m ago @Crispi74

Do you have any info on the gear ratios of the Hamann car?
Are they like standard F40, or something different?


User avatar

Crispi74  9m ago @196ss

The gearing is the standard uncatted car (with 2,727:1 as final ratio and 1,333:1 as gear from engine to gearbox).

Try the test with standard aero drag, we add something on the time and remove on speed if necessary because rear wing is adjustable.


User avatar

196ss  9m ago @Crispi74

Ok, accepted!


User avatar

Crispi74  9m ago @196ss

Auto Retro tested a couple of F40s during the years, one was 1989 model with straight exhaust, the second was a catted 1992 model fitted with the same exhaust + LM package,(yes front hood and rear wing like the F40 LM).
The article reported these results:

1989
0-100 4.6
Km 21.0

1992 (LM package)
0-100 4.7
Km 21.5

Yes, surely tested in different circumnstances but seems that rear wing might loose just a very few tenths for air drag because must consider that catalysts fitted cars are usually slower than the others.
On the photos of the article, the wing was logically doted of the second adjustable flap on top of the main wing, and it was setted as intended to be (I mean as it was not adjasted for the lower downforce) + it was provided of a nolder on top, so aerodinamically surely an air brake compared the standard wing.


User avatar

196ss  9m ago @Crispi74

Here is the calculation of F40 acceleration with Sportec engine tune.
663PS@6660rpm, 789Nm@5260rpm
Aero and gear ratios – as standard F40. Weight – 1280 kg with the driver. Conditions – 18 deg C, 1013 mBar.

bradenton-motorsports-park-44.jpg?550x80

Pretty sure to achieve 200 in 8,2 Hamann car should have more power than this.


User avatar

Crispi74  9m ago @196ss

Thanks guy, you are very helpful!


User avatar

Corvolet3  9m ago @196ss

100-200 in 4.7 seconds? That's almost as fast as a 720S!


User avatar

196ss  9m ago @Corvolet3

Yes, but it won't be easy to achieve, given that a car with so much torque and low weight will be very prone to wheelspin in the first two gears.


User avatar

Crispi74  9m ago @196ss

We must consider the important thing of the turbocharged air temperature. The Hamann being slightly less powerful in real circumnstance could be faster on 100-200 kph because of the turbo were cold at the beghinning of the lanch. The same would be here with the Sportec car. This calculation is standardized on delivering the same power in every gear.


User avatar

196ss  9m ago @Crispi74

Maybe.
Another factor I forgot to mention is tires. The calculation is presented on road tires, if we replace them with slicks, traction will improve and 0-100 will drop to 3.5 and 0-200 to 8.1.


User avatar

Crispi74  9m ago @196ss

In my idea when the Hamann was tested, it did 0-100 kph in 3.8, then it did 8.2 to 200 kph but the car was able to 300 kph in no less than 12 or 13s later, so 300 kph around 20 or 21s.
All of that translate in a time of 400m about 10.8s, 1000m in about 19s running around 290 kph.


User avatar

196ss  9m ago @Crispi74

This situation look like more power and less torque IMO. Let's say 670-680 PS and 720-730 Nm


User avatar

Crispi74  9m ago @196ss

All of that translate in a time of 400m about 10.8s, 1000m in about 19s running around 290 kph.

The fact that the Hamann has a rear wing, in the photos seemed not so adjusted for high downforce when it wasn't used at Hockenheim, but wing profile was grater and provided of a nolder. Photos made at Hockenheim time attack the wing was adjusted for the fast lap so more inclined to produce downforce.
I don't know how much this detail eated on drag, normal adjustment but surely I'm more inclined to think a low 19s time (maybe 19.2~19.3) with a speed of about 285 kph.


User avatar

196ss  9m ago @Crispi74

Not sure about that, higher drag at low speeds make very little difference, but after 250 kph it's influence should be a serious factor.
For example Cd (F40LM) = 0.63 (I suppose in high df settings), Cd (F40stock) = 0.34. This means that if we put LM aero on standard F40 top speed would be reduced by ~23%.


User avatar

Crispi74  9m ago @196ss

Not very clear here. Top speed reduced by 23% means 250 kph. I think il will be too low. I tought over 310 kph for sure. Are you meaning that?


User avatar

196ss  9m ago @Crispi74

Top speed is directly proportional to the cube root of power and inversely proportional to the cube root of drag coefficient.
Strictly speaking, rolling friction also has an influence, and I take this into account in my calculations. But, compared to airdrag, this influence is much smaller, so it can be neglected to a rough approximation.
Accordingly (the difference in frontal areas are not very much):
325/(cube root (0.63/0.34))=325/1.22825=265 kph
This value of 0.63 you gave me from the F40 LM book.

141f5fb23728.jpg?550x800m

I assume these figures are for the max downforce configuration. I think on tracks like Monza or Nordschleife, a lower downforce configuration with a 0.4-0.45 drag coefficient would be more effective.

Another example is the last generation of Viper. The base model has Cd 0.369 and a top speed of 330 kph. Viper ACR has Cd=0.541.
So, the estimated top speed should be:
330/(cube root (0.541/0.369))=330/1.13603=290 kph
In reality it's even less because of gearing.


User avatar

Crispi74  9m ago @196ss

I assume these figures are for the max downforce configuration. I think on tracks like Monza or Nordschleife, a lower downforce configuration with a 0.4-0.45 drag coefficient would be more effective.

Surely.


User avatar

Crispi74  9m ago @196ss

Not sure about that, higher drag at low speeds make very little difference, but after 250 kph it's influence should be a serious factor.

I'm asking me how much could affect trap speed at the distance of the Km. As for example on one of these cars. Could be used the same formula of top speed, do you think that?


User avatar

RacingLoverSRT  9m ago @Crispi74

I apologize - does anyone know or is there information on the Internet about how fast the F40 LM is in acceleration from 0-200 and 0-300, many thanks to everyone who answers!


User avatar

Crispi74  9m ago @RacingLoverSRT

Unfortunately there is not any firm info also because of the variable of engine specs, gearing and drag on the F40 LM. Basically we can say that trap speed at Fiorano track test was 275 kph and it did over 300 kph exactly on the finish line at Monza.
Take count that these speeds achieved were very high even at nowadays comparisons.


User avatar

RacingLoverSRT  9m ago @Crispi74

Thank you!


User avatar

196ss  9m ago @Crispi74

That's what happens if we play with the aerodynamics parameters in the calculation for the standard F40:

standard aero (Cd - 0.34, aero efficiency - 0.5) – 20.63 sec @ 266 kph, top speed 325 kph;
LM low downforce estimated (Cd - 0.40, aero efficiency - 0.7) – 21.03 sec @ 257 kph, top speed 309 kph;
LM medium downforce estimated (Cd - 0.50, aero efficiency - 1.1) – 21.71 sec @ 241kph, top speed 284 kph;
LM high downforce (Cd - 0.63, aero efficiency - 1.4) – 22.42 sec @ 226 kph, top speed 263 kph (4-th gear).


User avatar

Crispi74  9m ago @196ss

The article reported these results:
1989
0-100 4.6
Km 21.0
1992 (LM package)
0-100 4.7
Km 21.5

They evidently setted the wing at low dowforce for the F40 with LM package tested by AutoRetro.


User avatar

Crispi74  9m ago @RacingLoverSRT

Basically we can say that trap speed at Fiorano track test was 275 kph and it did over 300 kph exactly on the finish line at Monza.

I'm thinkng with the speed available at Fiorano and Monza, looking at how fast Sportec F40 was we can guess for an F40LM performance like the following:
0-100 3.1 (as claimed)
0-200 ~7.0
0-300 ~18.0
Sportec F40 should be over 260 kph at Fiorano on the main straight and close to 290 kph at the finish line at Monza.


User avatar

Crispi74  9m ago @196ss

F40 standard aero (Cd - 0.34, aero efficiency - 0.5) – 20.63 sec @ 266 kph, top speed 325 kph

Let me understand, those figures were done with the 506 PS diagram as starting baseline of the Sportec F40?


User avatar

196ss  9m ago @Crispi74

Yes


User avatar

Crispi74  9m ago @196ss

Can you show me all the acceleration data you found with the 506 PS baseline of the Sportec F40? I'm interested to look at some time partials.

Here you are imo an accurate diagram of a cat F40, so you have both real world examples of engine to do a right comparation:
https://ibb.co/fk4669f


User avatar

196ss  9m ago @Crispi74

Sure!
But have to wait a couple days. I'm still on a business trip and I don't have my laptop with me.


User avatar

Crispi74  9m ago @196ss

No problem!
Remember that to be accurate the final gear ratio, was shorter for the car equipped with cats.
Regarding weight, the cat car was 40 kgs heavier on a plexi lexan windows car, because of 30 by catalists + 10 by the windows.


User avatar

196ss  9m ago @Crispi74

the final gear ratio, was shorter for the car equipped with cats

Didn't know about that.
Same gearing as tipo USA?


User avatar

Crispi74  9m ago @196ss

Yes, the cars equipped with catalysts has the final gearing ratio of 2.90:1.
The same as Tipo USA cars. Or better, are the Tipo USA cars that has the same gearing as the ROW cars fitted with cats, because the latter spec was produced earlier.


User avatar

196ss  9m ago @Crispi74

bradenton-motorsports-park-63.jpg?550x80


User avatar

196ss  9m ago @Crispi74

you could pick, say, a dry hot day and a dry cold day, and take several consecutive acceleration measurements in 2nd and 3rd gear starting at low rpm

I've done the part of the work.
I made 4 runs at 4th gear 80-200 kph. The car - 2013 Audi A6 3.0 biturbo, 1/3 tank, 98 octane, conditions - 1022 mBar, -13 deg C. 3 runs are done consecutively, the 4th one after 3-4 minutes. Cooling system temperature did not change.
1st - 22.93 sec
2nd - 22.14 sec
3rd - 22.38 sec
4th - 22.64 sec
Now just have to wait for the heat to take repeated measurements.


User avatar

Crispi74  9m ago @196ss

Thanks, well done!


User avatar

Crispi74  9m ago @196ss

The acceleration results of the dynoed F40s are helpful and very interesting thanks again but they raise many questions for me. I can't explain some things, the reason why as in the example AMS gets a worse 100-200 kph time when the engine expressed power is delivering closer to 550 hp at that moment. That dynoed car you calculated would be faster just using a diagram line of 506 PS. Maybe AMS was wheelspin too much in 2nd gear(?) but then It should be faster lanching 3rd and 4th gear, which it wasn't that much. Why happened that? Secondly I'm asking then, what was averaging the power of all those tests that come out below 260 kph at the end the km. CarGraphic for example did 255 kph at 1000m trap speed, its 0-280 kph was achieved in more than 30 secs. I'm sure its engine was closer to 478 claimed but It doesn't explained 0-280 kph varied by 7 secs and yet conditions were fine. Looking at calculated data it seems that CarGraphic was deliveling very less than 478 that I'm sure it wasn't. Your calculated catalysed 492 PS car was already much faster than what CarGraphic reached on top of its 4th and 5th gear acceleration times.
Third thing, the catalyst car you calculated in your datapanel seems very close to the car that was uncatted, it was far just 3 tenth and 1 kph at the end of the standing km. Honestly looking our tests or data I own it was more marked difference expecially on speed. I'm unable to explain me mainly because Euro cat stock F40s when they raced 1992 were just fast close to 270 kph at Monza and 256 kph at Mugello. Both speed much slower than some other uncatted cars were able to achieved looking at the distance accumulated on time. Your calculated accelerations versus distance will corfirm to us
that instead, easily that catalysed cars should been much faster than they actually were, even on straight when they raced. Try to help me on these detail to fix. On the other hand I'm the first to understand the fact that your matematical results are calculated based on fixed data provided, so well proportional data for sure. But that a catalysed F40 running 1000m close to 265 kph and much faster than some other uncatted cars for real it shock me quite a bit. Why on real world these kind of variations from these examples are grater? How does we can explain to us?


User avatar

196ss  9m ago @Crispi74

Your questions are reasonable, and I may not be able to give an exhaustive answer on all of them, but I'll try to explain what I can.
Let me start with the fact that the difference in max power is only 2.8%, which isn't that much, the difference in test weight is also about 3%. Taking into account shorter gears it really turns out on some individual segments the thrust of the cat car is superior.
Serious advantage in torque on the 4-5k rpm range has little effect on the acceleration in a straight line, but can be very useful while cornering. It could be that the decat version could be noticeably quicker on the Monza and Mugello straights, as it makes a greater punch on corner exit.
Further, as for the AMuS car, I got 340 kW at the wheels in the 160-180 km/h section, which corresponds to revs of 6000-6800. The AMuS car run that section in 1.2 sec, the calculated 506 PS in 1.3.
As for the trap speed at the 1000m mark, we may still have something to discuss out here. In most tests, after 220 km/h the acceleration intensity is slightly reduced compared to the estimated calculated figures. This is probably due to a decrease in intercooler efficiency as a result of heavy engine use, as we have discussed in another thread. It is likely that both the 506PS and 492PS engines in the real world wouldn't have been able to retain juice until 4th and 5th gear and the trap speed could have been around 260km/h or maybe even lower.
However, we had seen that French test, and Ferrari factory claim apparently is a 1000m trap speed of 270km/h.
Still, even with all that, it seems that the cat and decat versions are too close in performance. Probably one of the explanations could be that the 506PS decat engine was rather mediocore, there were better ones, while the 492PS cat was probably one of the strongest examples.


User avatar

Crispi74  9m ago @196ss

I colpletely agree all you are saying.

This is probably due to a decrease in intercooler efficiency as a result of heavy engine use, as we have discussed in another thread. It is likely that both the 506PS and 492PS engines in the real world wouldn't have been able to retain juice until 4th and 5th gear and the trap speed could have been around 260km/h or maybe even lower.

I want to add that maybe greater decrising performance due to the cooling is that catalyst cars were the problem to produce more heat than uncatted cars due to the catalysts on the engine bay. Cars provided with catalysts had a cooling duct to the wastegate valve to partially remedy the problem. It's evident that during heavy engine use in real world that fisical problem comes out more heavily.

Looking at CarGraphic car I have the suspect that higher times comes from the nature of the engine curves, like it was tharlt 4th gear works fine up to 240 kph with a greater power drop over 7000 rpm than other cars tested. In the test panel was said the 4th gear was lanched 262 kph and 240-260 kph elapsed time was very high. The article explain the car was tested at Yatabe as brand new and the engine needed to be complete the broken in.


User avatar

196ss  9m ago @Crispi74

Yep, that's pretty much it.
Also, I'm wondering if it could be that the cat engine was tuned to a slightly higher boost pressure in the upper rpm range to compensate for the power drop. As well known the overheating directly connected with the boost level.

I took this shot at one of the carshows next to the F40 on display.

bradenton-motorsports-park-64.jpg?550x80

I don't know if this 21.0@270 is a factory test, or some kind of estimation?


User avatar

RickyAstle98  9m ago @196ss

Its estimation!


User avatar

Crispi74  9m ago @196ss

I don't know if this 21.0@270 is a factory test, or some kind of estimation?

During factory test the car did 20.9@268.

Sec. - Km/h. - meters.
4.1 - 100 - 54.6
11 - 200 - 346.9
11.9 - 209.1 - 400
20.9 - 268.7 - 1000


User avatar

196ss  9m ago @Crispi74

Perhaps some kind of rounding off.


User avatar

Crispi74  9m ago @196ss

Now I will look better at the catalyst car road tests (AutoHebdo tested one) and I will read again at the article where the 1992 GT Champion driver explain a full lap in Monza with his stock catalyst F40. He quickly said that he did the Parabolica corner in 3rd gear passing the finish line in 4th gear close to the limiter, and he starting braking close to 270 kph for the first chicane. From the Parabolica apex to the finish line was ~850m, from the finish line to point of bracking was ~400m. Looking at the gearbox speed vs rpm it seems he did 250~270 kph in ~400m. Your calculations reported 250-280 kph = 479m, this is why real world high speed performance of catalyst car were lower related to a dyno 492 PS calculated. I'm inclined to think that the catalyst car was really in the 478 PS range when engine was overstressed by heat (and 478 maybe being generous?). When Quattroruote tested its car, it was a non cat car, was faster than that car under distance, it was even surely overstressed by heating being it tested on a hot day in August. These are my thoughts on that argument.


User avatar

196ss  9m ago @Crispi74

Looking at this picture it seems that track goes uphill on this section:

b6a85ffcdfe7.jpg?550x800m

Here is results with the factory 478PS, 577Nm graph:

bradenton-motorsports-park-65.jpg?550x80


User avatar

Crispi74  9m ago @196ss

Yes altimetric profile of the old Monza track said the main straight was slightly uphill.
I'm saying the old track because in that period the first chicane was different.

Mugello main straight is more uphill expecially at the end of the straight. Here the speed in 1992 were 238 kph at the finish line, 256 kph at the max trap speed (distance 342m).

In 1993 championship rules were changed, the cars were much faster behind NGT upgrated.

Here Auto Hebdo main data, F40 catalyst version:
1310 kg
0-100 kph 4.6
400m 12.0
1000m 21.7


User avatar

196ss  9m ago @Crispi74

If you have an info about elevation changes, I can calculate how that would affect acceleration.

Here Auto Hebdo main data, F40 catalyst version:
1310 kg
0-100 kph 4.6
400m 12.0
1000m 21.7

It's heavier than our calculated model at around 100 kg.


User avatar

Crispi74  9m ago @196ss

Looking at Google Earth Monza straight seems to be averaging 1% uphill.
For the Mugello the question is different, from the Bucine corner there is sligtly underhill before, than later it comes uphill averaging 2.5% but later comes more than 4%.

AutoHebdo I think was referring weight at full tank included.


User avatar

196ss  9m ago @Crispi74

AutoHebdo I think was referring weight at full tank included.

The question is did they tested acceleration with the full tank?


User avatar

Crispi74  9m ago @196ss

I think yes, the data panel say as "1310 kg verified". Maybe the car has also fire system.


User avatar

Crispi74  9m ago @196ss

Summarazing on weights, my considerations are that:
1170 kg lexan car with no gas
1180 kg glass windows car with no gas
1210 kg glass windows car with no gas, with cats.
USA cars are 115 kgs heavier.

That car tested by AutoHebdo seems to be sligtly heavier than how cat cars were to been, but gadgets like fire system make the car weight little more for sure.


User avatar

Crispi74  9m ago @196ss

Anyway the reason why during the 1992 GT Championship made here in Italy, the power were very livelled to 478 PS to all the cars, I'm sure in 1992 can race both specs with and without cats. I was personally there on some races.
Anyway the reason was that to race rules said that everything need to be as designed. So Ecu data and wastegate internal sping must be setted as designed from the paper projected.

During the 1993 rules changed totally by CSAI GT regulations, all catalysed cars, the F40 could be sliglty tuned on every detail, starting from suspensions architecture using uniballs to the alignment, passing from bigger Brembo brakes systems, closing from stronger IHI turbos, Ecu mapped, straight exhaust and boost increased a bit. Also lighter hoods panels may been used. Their direct competitors were the XJ220 also tuned within regulations.
But here the right power for the F40s comes to be harder to fix because these configurations of engines varied for the difference of the engine setting, the ability of the tuner or the budget available of the team or the gentleman driver.
I can only say you that the Mugello speed was a conservative 272 kph during race compared to the 256 the year earlier. It was said to be about 280 during qualifying for the fastest cars.

Later the Italian Championship loose interest because then it started coming the much more important Global GT Championship, named BPR.But that's another story.


User avatar

196ss  9m ago @Crispi74

Just curious.
Did they really race with standard aero and no weight savings until 1993?


User avatar

Crispi74  9m ago @196ss

Yes standard aero. Saving weights just for the richest team, that was than the winner team, using lighter body panels for the hoods. Weight drop down to 1120-1130 kgs as claimed by Michelotto. Body panels were the same material as standard production cars but made with panels tinier structure. Lighter parts means also more expensive to race.


User avatar

196ss  9m ago @Crispi74

Calculated numbers for the 478PS power curve:
250-270kph
flat - 4.32sec, 313m
1% uphill - 4.91sec, 355m
238-256kph (including 4-5 gearshift)
flat - 3.72sec, 255m
2.5% uphill - 4.84sec, 331m


User avatar

Crispi74  9m ago @196ss

yes maybe the portion of track that the car did 238-256 kph was more inclined to be closer to 4% uphill, but we are totally sure that 238-256 kph 342 meters was a 478PS car or just little more.

Try to calculate 492PS dynoed car for a 4% uphill... we are sure result will be more accurate. I'm curious at that point.

At Monza the car was brand new. Mugello was the 5th race so the engine was accumulated lots of kms and for sure it deliver a bit more power.


User avatar

196ss  9m ago @Crispi74

Calculated numbers for the 492PS power curve:
238-256kph (including 4-5 gearshift)
flat - 3.50sec, 240m
4% uphill - 5,37sec, 368m

I suppose 4% is a bit overrated figure


User avatar

Crispi74  9m ago @196ss

Google said me that this morning, 3.9-4%.....but if the conditions were fine the car could be deliver more than 492PS ... I don't know which direction is the better one, the race was late July, so temperature was high.


User avatar

Crispi74  9m ago @196ss

Looking at Google Earth maps I think that the bridge from finish line to the trap speed interferes with the average data of the altitude. Maybe the correct percentage will be more like 3.7%.

Am I wrong or can we suspect that winner car seems to be really a 500PS car?


User avatar

196ss  9m ago @Crispi74

With the percentage of 3.7% we get 353m, 342m is obtained with an average uphill of 3.44%.
Generally, we can say that, taking into account possible errors, we more or less there:)


User avatar

Crispi74  9m ago @196ss

b93be9c4b0cd.jpg?550x800m

Was that I thought from long, that car was at Mugello already delivering about 500PS.

The 1992 IT GT Championship Mr. Rory Parasiliti and his F40.


User avatar

196ss  9m ago @Crispi74

Perhaps I'm not stating it technically correct, but I have an intuitive feeling that under acceleration, brief explosive bursts of power in 2nd and 3rd gears cause overheating, which reduces engine output somewhat, but then (usually after shifting to 5th), engine output stabilizes and returns to nominal value.
I assume that this happen due to more efficient heat exchange since power (and with it the amount of heat released) increase not so rapidly, and also due to the fact that the radiators get more air as the speed of the vehicle is higher.


User avatar

Crispi74  9m ago @196ss

Let me understand if that is the same message I tried to leave you.

You are saying that lower gears are delivering a power that was higher that nominal but their explosive bursts cause overheating. Overheating means that power decrese throught running higher gears. Than, once in 5th gear speed increased and the cooling also improve cause of the amonut of air through the intercooler. Power will be stabilized to the nominal.

https://ibb.co/zrVDrr1

The gear/dyno you posted for AMS properly explain what does that means. The car deliver the highest power in 3rd gear, maybe 2nd has a prolonged micro wheelspin but power had to be higher. Once in 4th and 5th gear power decrease cause of the overheating. The power drop come to be closely related at how engine heat and the cooling works. When in 5th gear power will be only there or close to the nominal power. But here cooling and the better heat exchange will be vital in terms of how the engine will deliver. That's happened on the situation of a launch from zero.
When use became intensive, on the freeway or during lapping a track, the condition change a little bit because the temperature of the turbos comes to be stabilized and power on lower gears in my idea will come to be not as high as starting from zero with the turbos starting a run at cooler temperature.
Here we can have all the reasons to feel that the heat exchange better at higher speed will be even more relevalt.


User avatar

196ss  9m ago @Crispi74

Yeah, that's probably so.
What I'm trying to say is that since everything happens very fast, at the initial stage the processes that degrade power are "lag" behind the power output to the wheels, and therefore it seems that the engine overperformes, then these processes catch up and as a result the engine underperformes, and after that, when everything is more or less balanced, the processes become stable.
I'm not sure if my guess is correct, or how to quantify it.
On tracks, this situation is also possible I think when exiting very slow corners to straights.


User avatar

196ss  9m ago @Crispi74

Regarding the inclusion of the discussed effect in the mathematical model, the key point here is the heat dissipation rate. Here again I am faced with a lack of initial info. It is easy to calculate how much heat is released, it is possible to find an estimate of heat transfer coefficients for parts and materials in the system, but it is not clear how to calculate the rate of heat dissipation.
Probably a good thing to start would be to find the cooling fan productivity.


User avatar

Crispi74  9m ago @196ss

Coming back to races, I thought this thing: because during 1992 rules admitted both F40 specs, catalyzed and uncatted cars and the winner wasn't slower on straight with a catalyzed 500PS car. What was the average power for uncatted cars to been fast as the winner car?


User avatar

196ss  9m ago @Crispi74

It's hard to say for sure.
There are so many nuances. If we talk specifically about the torque curves we have considered (492PS and 506PS), have you noticed that around 7000 rpm and above there is almost no difference between the two?
Since they have different axle ratios, when comparing some partial acceleration segments, very much will depend on what the rpm range is for each of the cars. Obviously in most cases the uncat car will have an edge. But as I said, there are so many other things that can make an influence - tires, driving style, lighter parts, more efficient brakes, and eventually things like rubber on the surface and the effect of air thinning if the cars are following each other....


User avatar

Crispi74  9m ago @196ss

I said you that because I found strange that was a catalysed car as remebered as the fastest trap speed car at Mugello 1992 race. I always found strange because I really don't know it was the fastest or just because the winner car.


User avatar

196ss  9m ago @Crispi74

It's a bit strange, really.
Perhaps it matters that the lighter cars suffer less than others when accelerating uphill, and as you said, the winning team's car was lighter.


User avatar

Crispi74  9m ago @196ss

No, we are referring to 1992 and the cars were standard! You are referring to 1993 that cars may been tuned but even cars were faster.

In 1992 reading at the CSAI rules, the rules on how to direct the tune, the cars had to be untouched, just alignment and balancing engine parts, that I don't even know if someone found that works as necessary.


User avatar

196ss  9m ago @Crispi74

Oh, OK.
Misunderstood.


User avatar

Crispi74  9m ago @196ss

It makes you think there were no uncatted 500PS cars there. Unless everything had to be double checked as blueprinted, as in the project paper. I have no other detail to suspect.


User avatar

196ss  9m ago @Crispi74

I'm a little confused.
Here you wrote about weight savings:

Yes standard aero. Saving weights just for the richest team, that was than the winner team, using lighter body panels for the hoods. Weight drop down to 1120-1130 kgs as claimed by Michelotto. Body panels were the same material as standard production cars but made with panels tinier structure. Lighter parts means also more expensive to race.

Does that mean 1993?


User avatar

Crispi74  9m ago @196ss

641757983f78.jpg?550x800m

Yes 1993.

That's the winner, Marco Brand, F40 Jolly club team. The car was fully upgrated by Michelotto, fitted with ligther hoods parts and lexan windows, LM suspensions on uniballs, bigger Brembos, engine tuned under CSAI rules between 520 to 590 PS. As you can see, standard aero.


User avatar

Crispi74  9m ago @196ss

Still 1993. Car that raced 1992 in standard form, the 1993 Upgrated.

438643c74d7f.jpg?550x800m

The car was driver by Pierre Popoff, Ferrari Club Italia team, standard suspensions, bigger Brembos, standard hoods and engine less tuned delivering something like 520 to 550PS.


User avatar

Crispi74  9m ago @196ss

Still 1993. That car was later upgrated by Michelotto to GTE specs for BPR Global Championship, the famous #90001 car.

e07593cfa134.jpg?550x800m

Driver Luciano Della Noce, Strandell Team, Michelotto suspensions, bigger Brembos, standard hoods and engine less tuned delivering I think something like 500 to 520PS.


User avatar

196ss  9m ago @Crispi74

Could you please help me?
Please correct if I have wrong estimates somewhere.
The Porsche 917 (NA) mechanically driven fan at a max speed of 123.77 rpm sucks in 2400 liters of air per second or 19.4 liters per rev. Considering the difference in size, number and angle of the blades, I estimate that a single F40 electric fan sucks in no more than a fifth part of the 917 in one rev. The max speed of the electric fans is usually no more than 3000 rpm, or 50 revs per second.
I.e. approximately 2 F40 fans for a second can pull a maximum of 2×4×50=400l of air.
What can you say, don't you think this figure is too optimistic?

https://www.gt40s.com/threads/help-please-917-engine-fan-info.27715/

https://www.infinitous.co.uk/ourshop/prod_7093478-Ferrari-F40-Water-Radiator.html

It is also mentioned that the 917 fan takes about 17 hp from the motor's power, i.e. 12.5 kW.
Since the maximum output of Ferrari fans is six times less, and the efficiency of electric fans is about three times higher, the power consumption of one F40 fan is about 350W, which in my opinion looks plausible.

12.5/(6×3×2)=12.5/36=0.347


User avatar

Crispi74  9m ago @196ss

I.e. approximately 2 F40 fans for a second can pull a maximum of 2×4×50=400l of air.
What can you say, don't you think this figure is too optimistic?

This is what Schruf/Leyrer book said about cooling system of the F40.

https://ibb.co/tzhh6Pr

I think 13000L/h was referred to the max rate of the water circulation. I don't know if that can help you under term of heat exchange.


User avatar

196ss  9m ago @Crispi74

Also useful info about oil and water circulation rate, but no info about fan productivity.


User avatar

Crispi74  9m ago @196ss

I found that double fan start works at 84°C and stopped 75°C. No other info at the moment.

Changing argument, what I found inconsistant looking at the material we have now, is that to consider AMS a very powerful car.
Looking at 506PS diagram the car run 280-300kph 6.4s, but AMS was almost 1 second slower, that does suggest that when AMS fit the 5th gear engine output stabilizes and returns to nominal value but it seems more closer to 478PS than the dynoed at 506PS.
My suspect is that no need to be as high as 500PS to be fast as AMS was.
So I guess that to get really how these engines deliver need to before to be within its argument, because it's evident that during the engine factory delivery the process of test were checked lookg it any unit was able to deliver in stessed conditions the 478PS claimed, but these engines were able to adapt on every better conditions before to be highly heat stessed and deliver closer to their nominal figure. That's why you will find over 500PS every time your will dyno corrected an F40.


User avatar

196ss  9m ago @Crispi74

I have a different opinion. I'm pretty sure AMuS is absolutely 500+ car.
Firstly, AMuS tested the car with a full tank, as they always do. Secondly, the peak power of the AMuS car is apparently around 6300 rpm, and then noticeably decreases.
Look at the acceleration dynamics in 4th and 5th gear:

1739151ef7d8.jpg?550x800m

The curves have a noticeably convex shape, indicating that power decreases significantly with increasing rpm. I suggest that this is also the reason for the lower than expected top speed.
The car from the Auto test was also tested in Nardo, but it wasn't able to show the acceleration level of AMuS, although developed the maximum speed higher, which undoubtedly indicates that the Auto's peak power is in the zone of higher revs.
By the way the AMuS article said that Ferrari provided 2 cars for testing and both showed the same top speed. Wasn't there any information in the Schruf/Leyrer book about the difference in acceleration between the two cars?

bradenton-motorsports-park-66.jpg?550x80


User avatar

Crispi74  9m ago @196ss

I have a different opinion. I'm pretty sure AMuS is absolutely 500+ car.

Ok I belive you. But how do you think AMS did from 280 to 300 kph? I was referring based just on that data. Whay it was that much slower than 506PS claculated there? Maybe something wrong in the acceleration diagram I posted from 280-300kph?

Wasn't there any information in the Schruf/Leyrer book about the difference in acceleration between the two cars?

I don't think to had read that, but I will look with more calm, the book is very informative and maybe something can be loose traslating it from German.


User avatar

196ss  9m ago @Crispi74

Probably it just has less power in 6300-6800 rpm range.


User avatar

Crispi74  9m ago @196ss

Ok yes, understood.


User avatar

Crispi74  9m ago @196ss

Wait a moment. I want to get better that point.

The 506PS diagram shows us that 6790 rpm the power was little bit under 498PS. Maybe ~495.

Looking at AMS 5th gear the power at the wheels was ~415PS@6300rpm and ~404PS@6800rpm.

Now, I thought that if power at flywheels AMS was just 500PS@6300rpm, then @6800rpm it was no less than 496PS because Maha dynos suggest that losses increase more than proportional of speed.

Now my question is already why AMS seems slower 6300~6800 range. Numbers seems to me so close.

Sportec baseline diagram:
6390rpm = ~506PS
6780rpm = ~495PS

AMS taking as just 500PS max:
6300rpm = ~500PS
6800rpm = ~496PS

AMS taking as just 505PS max:
6300rpm = ~505PS
6800rpm = ~501PS

I have the impression that AMS perform well up to 6800 checking into detail.


User avatar

196ss  9m ago @Crispi74

I can't answer without looking into calculations.
Give me time please


User avatar

Crispi74  9m ago @196ss

I have the suspect that AMS loose speed over time running more than 280 kph at Nardo because of the angle effect that tack start to have at high speed.
But AMS wheel power diagram should have explain the reason.


User avatar

Crispi74  9m ago @196ss

Wasn't there any information in the Schruf/Leyrer book about the difference in acceleration between the two cars?

The book Schruf/Leyrer said that during test that day both cars reached 321 kph maybe because the pressure of tires was setted at 3 bar and they were not sure to find ideal wind conditions that day to found 324 claimed.


User avatar

196ss  9m ago @Crispi74

I have the suspect that AMS loose speed over time running more than 280 kph at Nardo because of the angle effect that tack start to have at high speed.

I was thinking that way earlier too, but after watching a few videos at Nardo it seems that at around 300km/h when moving at the outer banked lane, steering corrections are mostly non required. To accelerate 280-300 in 7.5 seconds would apparently need 600-700m, and that's only ~5% of the total length of the ring. On the other hand, I don't know perhaps course stability specifically for the F40 is an issue at these speeds.
The power diagram in the gears for the AMuS F40 is somewhat atypical, the car accelerates well in fourth gear for quite a long time, but fifth gear sags about 10% compared to the rest. It seems to me (this is just a guess) the issue in this case is not a reduction in engine power. Interesting to hear some more about the test conditions. Maybe wind or road surface defects could make some impact?

maybe because the pressure of tires was setted at 3 bar

Possibly that excessive wheelspin at the 2nd gear and poor 0-100 time are related to this fact.


User avatar

Crispi74  9m ago @196ss

I was thinking that way earlier too, but after watching a few videos at Nardo it seems that at around 300km/h when moving at the outer banked lane, steering corrections are mostly non required. To accelerate 280-300 in 7.5 seconds would apparently need 600-700m, and that's only ~5% of the total length of the ring. On the other hand, I don't know perhaps course stability specifically for the F40 is an issue at these speeds.

No sure on that. Don't forget that engineers calculated that XJ220 loose its top speed at Nardo due to the affect of the track:
"The Japanese Bridgestone men, on hand but always discreetly in the background, said that Nardo had 1.1deg of scrub all the way around- so a car never steers dead straight, and that palpably hurts top speed. Apparently, some manufacturers reckon you should add three percent to the Nardo figure, to get the real top, as would be achieved on a long, long straight. Add three percent to 217.1mph, and you get 223.6."
My suspect is that effect compromises the smoothness of the vehicle above certain speed. F40 is provided of a short wheelbase that was not that ideal running on very high fast runs.


User avatar

196ss  9m ago @Crispi74

You maybe right. I remember mr. von Koenigsegg also said that CCR 388 km/h at Nardo is equivalent to 400 km/h in a straight line. But still I think it all applies more to a higher speeds of 350+. For example, Auto was able to get the F40 up to 325 km/h in Nardo, I don't think there was much left. We may also remember 492PS Diablo VT 325km/h tested.
Take a look at this video please, you can start it about 7:00:


At 300 km/h everything feels pretty smooth and the road feels almost like a straight line. At 350 everything feels much more abrupt and jerky. Also looking at this video the pavement does not seem ideal, there are areas where there is a noticeable rocking and momentary losses of grip. And as the speed increases, these effects become more pronounced.
It seems to me that this is the most probable cause of somewhat spoiled acceleration on the 280-300 section. Perhaps it also happens in conjunction with the indirect position of the steering wheel due to the track character.


User avatar

Crispi74  8m ago @196ss

This is what Materazzi engineer said about top speed:

"According to Nicola Materazzi, 324 kmh is the F40's guaranteed minimum top speed; most of the cars will in fact be capable of 330 kmh (206 mph)!"


User avatar

196ss  8m ago @Crispi74

Well, it's entirely possible. Calculated F40 with 520 PS will have a top speed of about 330 km/h.
However, I think mr. Materazzi was talking about cars with the axle ratio of 30/11, if we talk about cars with 29/10, they are unlikely to be able to reach 324, because the revs in this case will exceed 7800.
By the way, what do you think of the top speed for F50?
With the claimed power and drag 325 km/h seems not possible. According to my calculations to reach the claimed to speed F50 will require 550 PS and rev the engine to 8770 rpm.


User avatar

Crispi74  8m ago @196ss

The F50 has a higher drag and some cars I doubt they had full 520PS. I saw a dyno showing 515PS and more than 51 kgms of torque. Reading what Werner Schruf book of the F50 said the 6th gear was long as 39 kph/1000rpm, limiter at 8700rpm. Anyway I always known that if it achieved 325 kph, it was made with lot of effort with powerful cars.


User avatar

196ss  8m ago @Crispi74

I thought more like 37kph/1000rpm and 8500.
There is the video in the net where it runs several seconds 328-329 on speedo at 8500 and doesn't want go any faster. I suppose it should be around 315kph GPS. Also C&D in their test achieved something like that.


User avatar

Crispi74  8m ago @196ss

Schumacher tested the F50 for Quattroruote Special magazine:
Top speed 326.459 kph 6th gear 8450 rpm
0-100 kph 4.1s
0-200 kph 12.4s
0-250 kph 20.1s
400m 11.9s @ 197.8
1000m 21.3s @ 251.6
Bracking 100 kph 38.5m
Bracking 200 kph 138.1m
Streering Pad r:55m 1.12g

According to Quattroruote 6th gaer was 38.6kph/1000rpm.


User avatar

288GTO  8m ago @Crispi74

0-300/322?


User avatar

Crispi74  8m ago @288GTO

Unfortunately no data. In Japan the F50 was able to run 0-300 kph 41.9s from a fast car.


User avatar

196ss  8m ago @Crispi74

I don't have this QR article, but I've heard about this test.
I hope someone can refute me (since I'm a big F50 fan) but I don't believe the top speed. As far as I know the tests were held in Vairano (2km straight) and Monza. Neither of places doesn't permit F50 to achieve 326 kph. Not even 300, which is probably why there's no 0-300. QR usually in this cases measures actual acceleration and actual drag, and from this data calculate top speed. I'm in no way accusing them of errors in calculations or fudging under pressure from Ferrari, but still it's not a proper testing as I understand it.
C&D reports about 36kph/1000rpm:

bradenton-motorsports-park-67.jpg?550x80

Probably there is some variables depending on tire pressure and circumstances. Are the F50 speeds on gears listed in the Cargraphic test?


User avatar

Crispi74  8m ago @196ss

Yes, Cargraphic gearing speed @ 8500:
1st - 97 kph
2nd - 130 kph
3rd - 164 kph
4th - 204 kph
5th - 251 kph
6th - na


User avatar

196ss  8m ago @Crispi74

Thanks!
So, more or less inline with C&D


User avatar

ZafiraTOUR  8m ago @Lambolover

The gearbox is also a mess and makes a loud banging noise and grinds, his car is not in a very good condition.


User avatar

Thiago_Lins  3m ago @Crispi74

Year test? Scans?


User avatar

Thiago_Lins  2d ago

Is 4 seconds from 0-100 km/h the best test result for the F40?


User avatar

humana  2d ago @Thiago_Lins

no. 4.1 is, the 4.0 seconds was added by some rando


User avatar

Thiago_Lins  2d ago @Crispi74

An owner once told me that the first F40s (1987) came out with power above 650 hp (about 25 cars). I've never been able to find references about this!


User avatar

BMWX5M  1y ago

Ferrari F40


And no it isn't. The Mclaren F1 is. Bipartisan agreements over the years online and offline. OUR experience.


User avatar

Corvolet3  1y ago

https://youtu.be/SwmEgJ9Q0nI?si=CULzdFt7TNBv_6vT

Damn, link doesn't embed. Anyway carwow races the Ferrari F40 vs the Bugatti EB110


User avatar

Crispi74  1y ago

It seems that Rosenbaum's F40 (Tipo USA) was able to run 3/4 of a mile with a terminal speed of 180 mph with an engine delivering up to 650 hp.


User avatar

HBO  2y ago


F40


User avatar

Ferrari (Z06 SUCKS BALLS)  2y ago


Liberty Walk F40


User avatar

TypeF173  2y ago

0791e0742bd7.jpg?550x800m

Sylvester Stallone visiting the Ferrari factory in Maranello Italy 1990


User avatar

Lambolover  2y ago


@hoppelmoppel123
200M 7.505 secs
400M 11.293 secs at 203.60 km/h


User avatar

wallenieswiftie  2y ago

Check out these in-house estimations

0-60 mph: 3.43 sec (pre-shift) or 3.91 sec (post-shift)
0-100 mph: 7.38 sec-> 60-100 = 3.47 sec

Street 1/4-mile: 11.62 sec @ 130.00 mph

Top speed: 194 mph (theoretical maximum velocity: 205 mph)

https://docs.google.com/document/d/1ERFzdIin1zS36ZjmkjahNwjwJAVxwoPCgNV2zJzn2Jo/edit?usp=sharing

https://docs.google.com/document/d/1ERFzdIin1zS36ZjmkjahNwjwJAVxwoPCgNV2zJzn2Jo/edit?usp=sharing


User avatar

Crispi74  2y ago

Please add these F40 & F50 times at Tsukuba

8cf82a71235a.jpg?550x800m


User avatar

Crispi74   2y ago

ROMBO magazine 1/90

Match bike vs car
Yamaha FZR 1000 Ex Up vs Ferrari F40
Airport surface, 5 Cdeg, no wind

BIKE:
0-100 km/h 3s
0-200 km/h 8s
400 m 10.2 @ 220 km/h
1000 m 19.2 @ 258 km/h

CAR:
0-70 km/h 3s
0-160 km/h 8s
400 m 11.7 @ -
1000 m 20.2 @ 265 km/h

PS. Car driver, Nicola Larini, ex F1 & DTM driver.


User avatar

hostboy  3y ago

@FastestLaps please remove the 19.9 1km time nonsense, while it's true that the F40 prototypes had roughly the same specs as the GTO Evoluzione (as pointed out by Thiago_Lins), those are far different from the regular customer-spec F40s which have slightly bigger wings and aren't straight piped

No '90s supercar besides the EB110 SS could even do low 20s, and even an F1 XP5 PROTOTYPE (which shouldn't even BE mentioned in the same breath as a customer production car) ran a barely better time at 19.6.

A customer F40 won't do any better than 20.9 to the first kilometer as pointed out by European mag tests. If an XJ220 can only manage 20.7, and an Enzo can only manage 20.1, and the EB110 SS can only do 19.8, then THE F40 ABSOLUTELY ISN'T DOING 19.9. It should be ONLY BARELY quicker than the F50.


User avatar

hostboy  3y ago

hostboy 4y ago

Why would you want to compare a GT500 or a Hellcat to this spectacular twin-turbo track beast? Not even those beat icons like an F40 on the track.

Sheed 2y ago

.... But the Camaro ZL1 1LE does. ????????????????

First of all, the ZL1 of either version only barely beats the F40. Stop talking out of your ass. The ZLE has advanced racing tires and has 30+ years in technology over the F40.

Mike11 2y ago

Keep your Camaro and i'll keep the F40 ????????

^THIS^


User avatar

hostboy  3y ago

Ferrari F40 (1987):
Claimed Power: 471 bhp / 478 PS / 352 kW
Actual Power (catalytic converter): 522 bhp / 530 PS / 389 kW
Actual Power (straight pipe): 638 bhp / 647 PS / 476 kW
Estimated Weight: 1378 kg with driver and fuel
Source of Estimations: TorqueStats *with several adjustments
Imperial acceleration figures (for U.S.):
▪ 0-30 mph: 1.625 s
▪ 0-60 mph: 3.100 s
▪ 0-100 mph: 6.515 s
▪ 0-150 mph: 16.277 s
▪ 0-200 mph: 47.506 s
▪ Top speed: 200.460 mph *average of both directions; limited by downforce
▪ 1/4 mile: 11.100 s @ 129.942 mph
▪ 1 mile: 27.503 s @ 183.584 mph
▪ 1' rollout: 0.370 s (4' rollout: 0.740 s)
Metric acceleration figures (for rest of the world):
▪ 0-100 km/h: 4.450 s
▪ 0-200 km/h: 11.500 s
▪ 0-300 km/h: 29.719 s
▪ Top speed: 333.333 km/h
▪ 0-380 m: 11.529 s @ 200.504 km/h
▪ 0-400 m: 11.797 s @ 205.165 km/h
▪ 0-1000 m: 21.033 s @ 270.446 km/h