@humana are Imsa/ BPR GT racing cars allowed to be added or not?
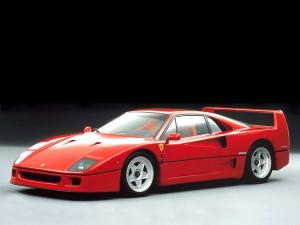
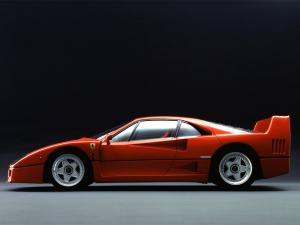
Ferrari F40 specs
| Price in US | $471,375 |
| Car type | Coupe |
| Curb weight | 1099-1369 kg (2423-3018 lbs) |
| Dimensions | 4.43 m (174 in) long, 1.99 m (78 in) wide, 1.13 m (44 in) high |
| Wheelbase | 2.45 m (96 in) |
| Introduced | 1987 |
| Origin country | Italy |
| Gas mileage | 32.0-8.6 l/100 km (7-27 mpg US / 9-33 mpg UK) |
| CO2 emissions | 250 g/km |
| Views | 137.5k |
Lap times
Performance
| 0 - 40 kph | 1.5 s |
| 0 - 50 kph | 2.0 s |
| 0 - 60 kph | 2.2 s |
| 0 - 70 kph | 3.0 s |
| 0 - 80 kph | 2.9 s |
| 0 - 100 kph | 4.0 s |
| 0 - 120 kph | 5.5 s |
| 0 - 140 kph | 6.5 s |
| 0 - 150 kph | 7.2 s |
| 0 - 160 kph | 8.0 s |
| 0 - 180 kph | 9.3 s |
| 0 - 200 kph | 10.4 s |
| 0 - 220 kph | 13.8 s |
| 0 - 240 kph | 16.4 s |
| 0 - 250 kph | 17.8 s |
| 0 - 260 kph | 20.1 s |
| 0 - 300 kph | 31.0 s |
| 100 m | 5.4 s @ 119.2 kph |
| 1000 m | 20.2 s @ 265.0 kph |
| 0 - 30 mph | 1.6 s |
| 0 - 40 mph | 2.2 s |
| 0 - 50 mph | 2.8 s |
| 0 - 60 mph | 3.8 s |
| 0 - 70 mph | 4.6 s |
| 0 - 80 mph | 5.4 s |
| 0 - 90 mph | 6.7 s |
| 0 - 100 mph | 7.7 s |
| 0 - 110 mph | 9.5 s |
| 0 - 120 mph | 11.0 s |
| 0 - 130 mph | 13.5 s |
| 0 - 140 mph | 15.6 s |
| 0 - 150 mph | 16.2 s |
| 0 - 160 mph | 21.3 s |
| 0 - 170 mph | 26.3 s |
| Est. 1/8 mile | 8.4 s @ 102.5 mph |
| 1/4 mile | 11.7 s @ 126.5 mph |
| Est. 1/2 mile | 19.0 s @ 159.7 mph |
| Est. 1 mile | 29.7 s @ 184.5 mph |
| Top speed | 327 kph (203 mph) |
| 0 - 100 mph - 0 | 13.8 s |
| Est. max acceleration | 0.68 g (7 m/s²) |
| Lateral acceleration | 1.01 g (10 m/s²) |

Powertrain specs
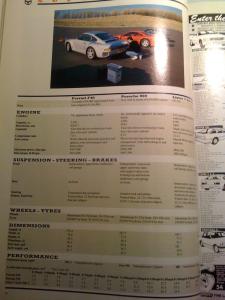
| Engine type | twin turbo V8, 32 valves |
| Displacement | 2.9 l (179 ci / 2936 cc) |
| Power | 478 ps (471 bhp / 352 kw) @ 7000 rpm |
| Tested power | 504 ps (497 bhp) @ 7000 rpm |
| Torque | 575 Nm (424 lb-ft) @ 4000 rpm |
| Power / liter | 163 ps (161 hp) |
| Power / weight | 374 ps (369 bhp) / t |
| Torque / weight | 450 Nm (332 lb-ft) / t |
| Efficiency | 27 PS per l/100 km |
| Transmission | 5 speed manual |
| Layout | middle engine, rear wheel drive |
Braking distance
| 60 kph - 0 | 13 m (44 ft) |
| 100 kph - 0 | 37 m (122 ft) |
| 120 kph - 0 | 54 m (176 ft) |
| 140 kph - 0 | 73 m (240 ft) |
| 160 kph - 0 | 96 m (313 ft) |
| 180 kph - 0 | 120 m (394 ft) |
| 200 kph - 0 | 149 m (490 ft) |
| 60 mph - 0 | 36 m (119 ft) |
| 70 mph - 0 | 66 m (218 ft) |
Rolling acceleration
| 60 - 100 kph (4) | 6.3 s |
| 80 - 120 kph (5) | 8.5 s |
| 80 - 160 kph (5) | 16.1 s |
| 70 - 100 kph | 8.2 s |
| 70 - 120 kph | 12.6 s |
| 70 - 140 kph | 16.1 s |
| Est. 100 - 140 kph | 2.2 s |
| Est. 100 - 200 kph | 7.0 s |
| Est. 200 - 300 kph | 19.6 s |
Interior noise
| Noise @ idle | 65 dB |
| Noise @ 100 kph | 81 dB |
| Noise @ 130 kph | 84 dB |
| Noise @ 160 kph | 90 dB |
| Noise @ 180 kph | 92 dB |
| Noise @ 50 mph | 82 dB |
| Noise @ 70 mph | 84 dB |
F40 competition
Ferrarif40 3m ago
https://www.facebook.com/groups/39483944474/permalink/10162032760554475/?app=fbl
I am wondering about that chassis sticker. Says 4 weights 830 kg but has 2 1430kg.
It has chassis code numbers of Ferrari so I am wondering this maybe a legit F40 Ferrari.

wallenieswiftie 5m ago
Ferrari F40
Lap times:
20,600 meters: 9:07.99 (estimated 8:22.24 with driver mod)
20,832 meters: 9:14.11 (estimated 8:28.35 with driver mod)
232-meter rollout: 6.11 sec
Dragstrip times (launching at redline rpm):
0-100 km/h: 3.5 sec
0-160 km/h: 6.6 sec
0-200 km/h: 11.0 sec
Standing start, 0-400 meters: 11.06 sec @ 200 km/h
Short rollout, 0-400 meters: 10.71 sec
Long rollout, 0-400 meters: 10.33 sec
Acceleration times (launching from idle rpm):
0-100 km/h: 5.0 sec
0-160 km/h: 8.2 sec
0-200 km/h: 13.3 sec
0-240 km/h: 17.8 sec
0-300 km/h: 29.4 sec
Standing start, 0-400 meters: 13.03 sec @ 198 km/h
Standing start, 0-1000 meters: 21.78 sec @ 268 km/h


Crispi74 6m ago
Anyway it was said that Tipo USA F40 was rated to be around 515 hp. It seems that during the process to refine gasses engineers found some extra power. In my idea that was just partially true, because lots of EU F40s were enough powerful to be faster than US cars. I always tought that that happens because of the same process of engine production more than other choice and no matter the figure Ferrari power claimed.

jeremyclarkson1 9m ago
https://en.wikipedia.org/wiki/List_of_Top_Gear_test_track_Power_Lap_times
So the Top Gear lap was a "Did Not Start".
@FastestLaps can I add this time?


Thiago_Lins 11m ago
Are there top speed figures achieved by the Ferrari F40 GTE in the BRP Global GT Series in 1995/1996?


Crispi74 1y ago
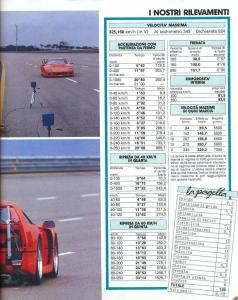
Auto Pur 1/94
Ferrari F40 road test
0-100 kph 4.0s
0-200 kph 11.0s
Dyno test: 504 PS @ 7000 rpm
Corvolet3 2y ago
https://youtu.be/SwmEgJ9Q0nI?si=CULzdFt7TNBv_6vT
Damn, link doesn't embed. Anyway carwow races the Ferrari F40 vs the Bugatti EB110
Crispi74 2y ago
It seems that Rosenbaum's F40 (Tipo USA) was able to run 3/4 of a mile with a terminal speed of 180 mph with an engine delivering up to 650 hp.